Astra Solutions — dashboard for performance monitoring
A Power BI dashboard built to track performance, monitor key metrics, and support faster decisions.
Project Overview
We supported the design and creation of an interactive Power BI dashboard for business performance monitoring.
The goal was to create a comprehensive visualization tool that helps management monitor key metrics across finance, operations, and performance. We focused on data readability, clear hierarchy, and balanced color accents so decision-makers could identify insights faster and act with more confidence.
Process
From concept to crafted detail.
A look at how the work came together — from early direction to the finished surfaces that ship.
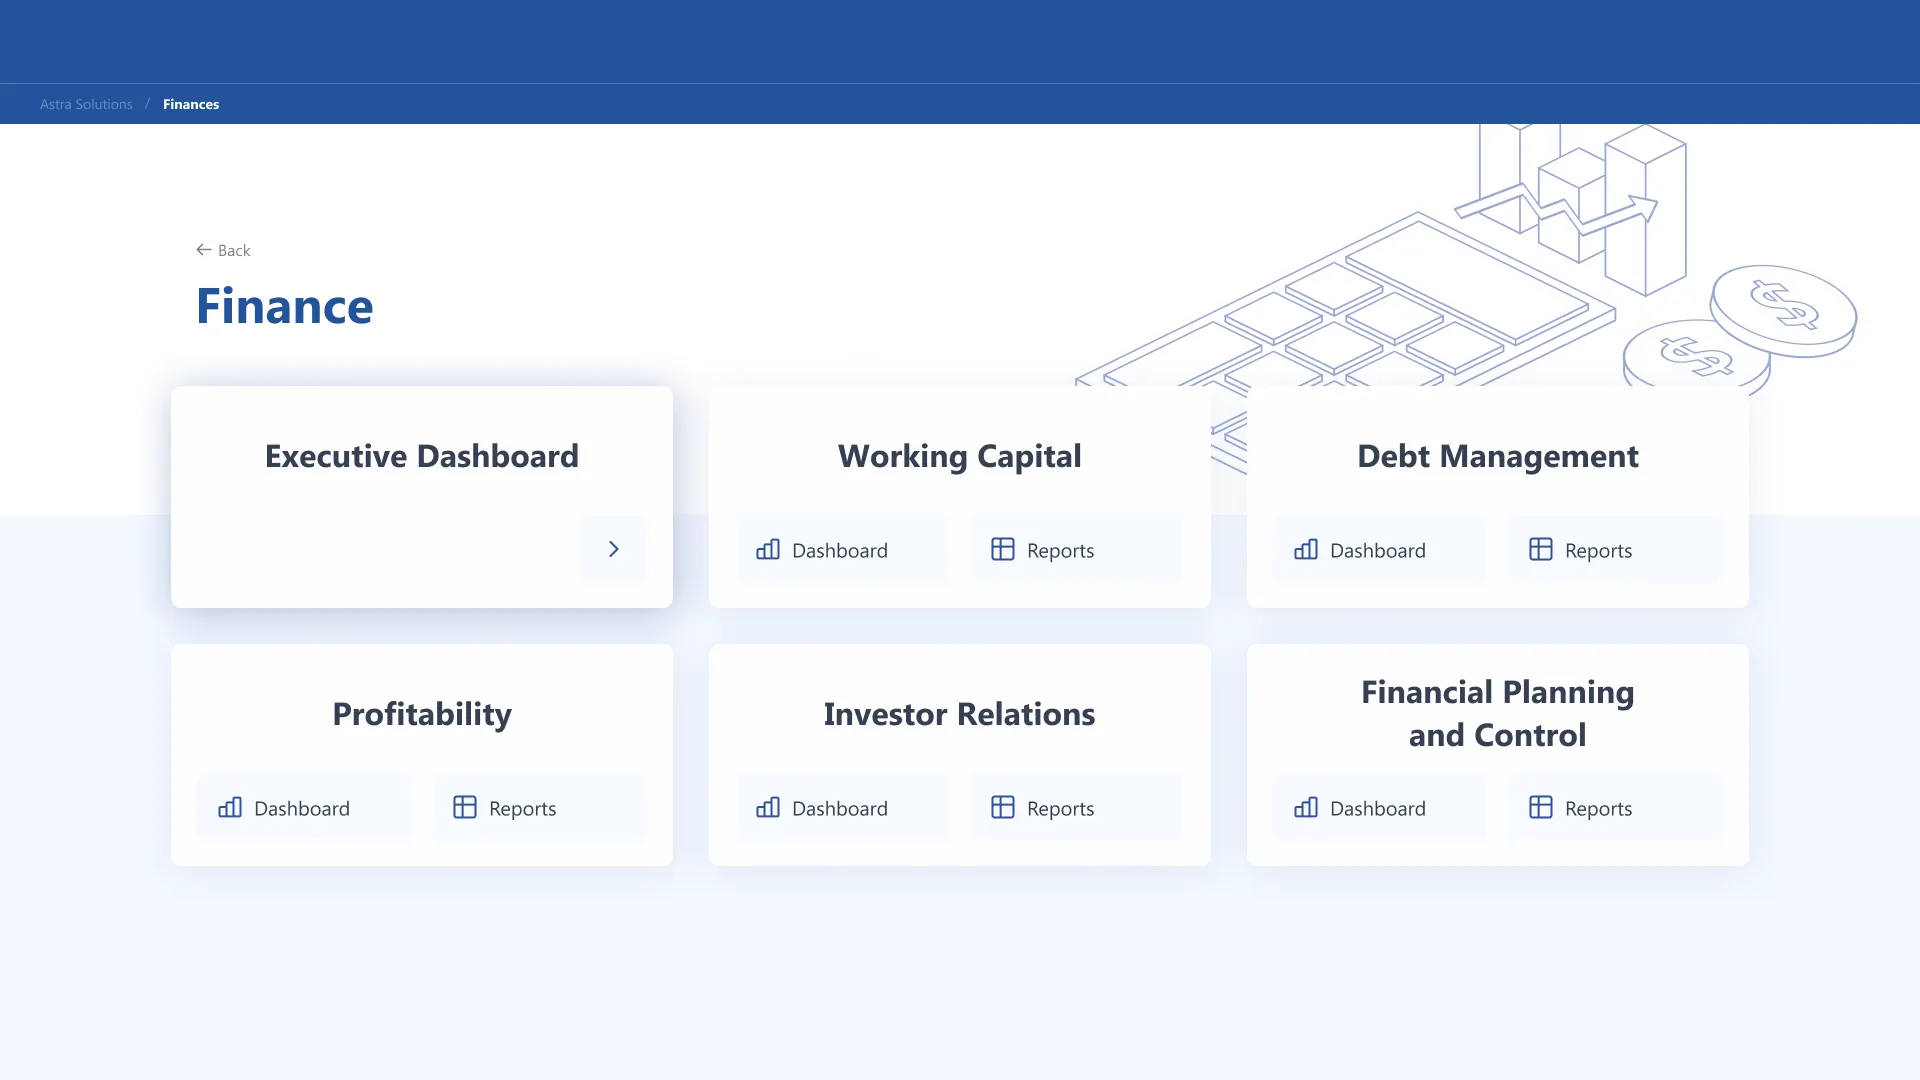
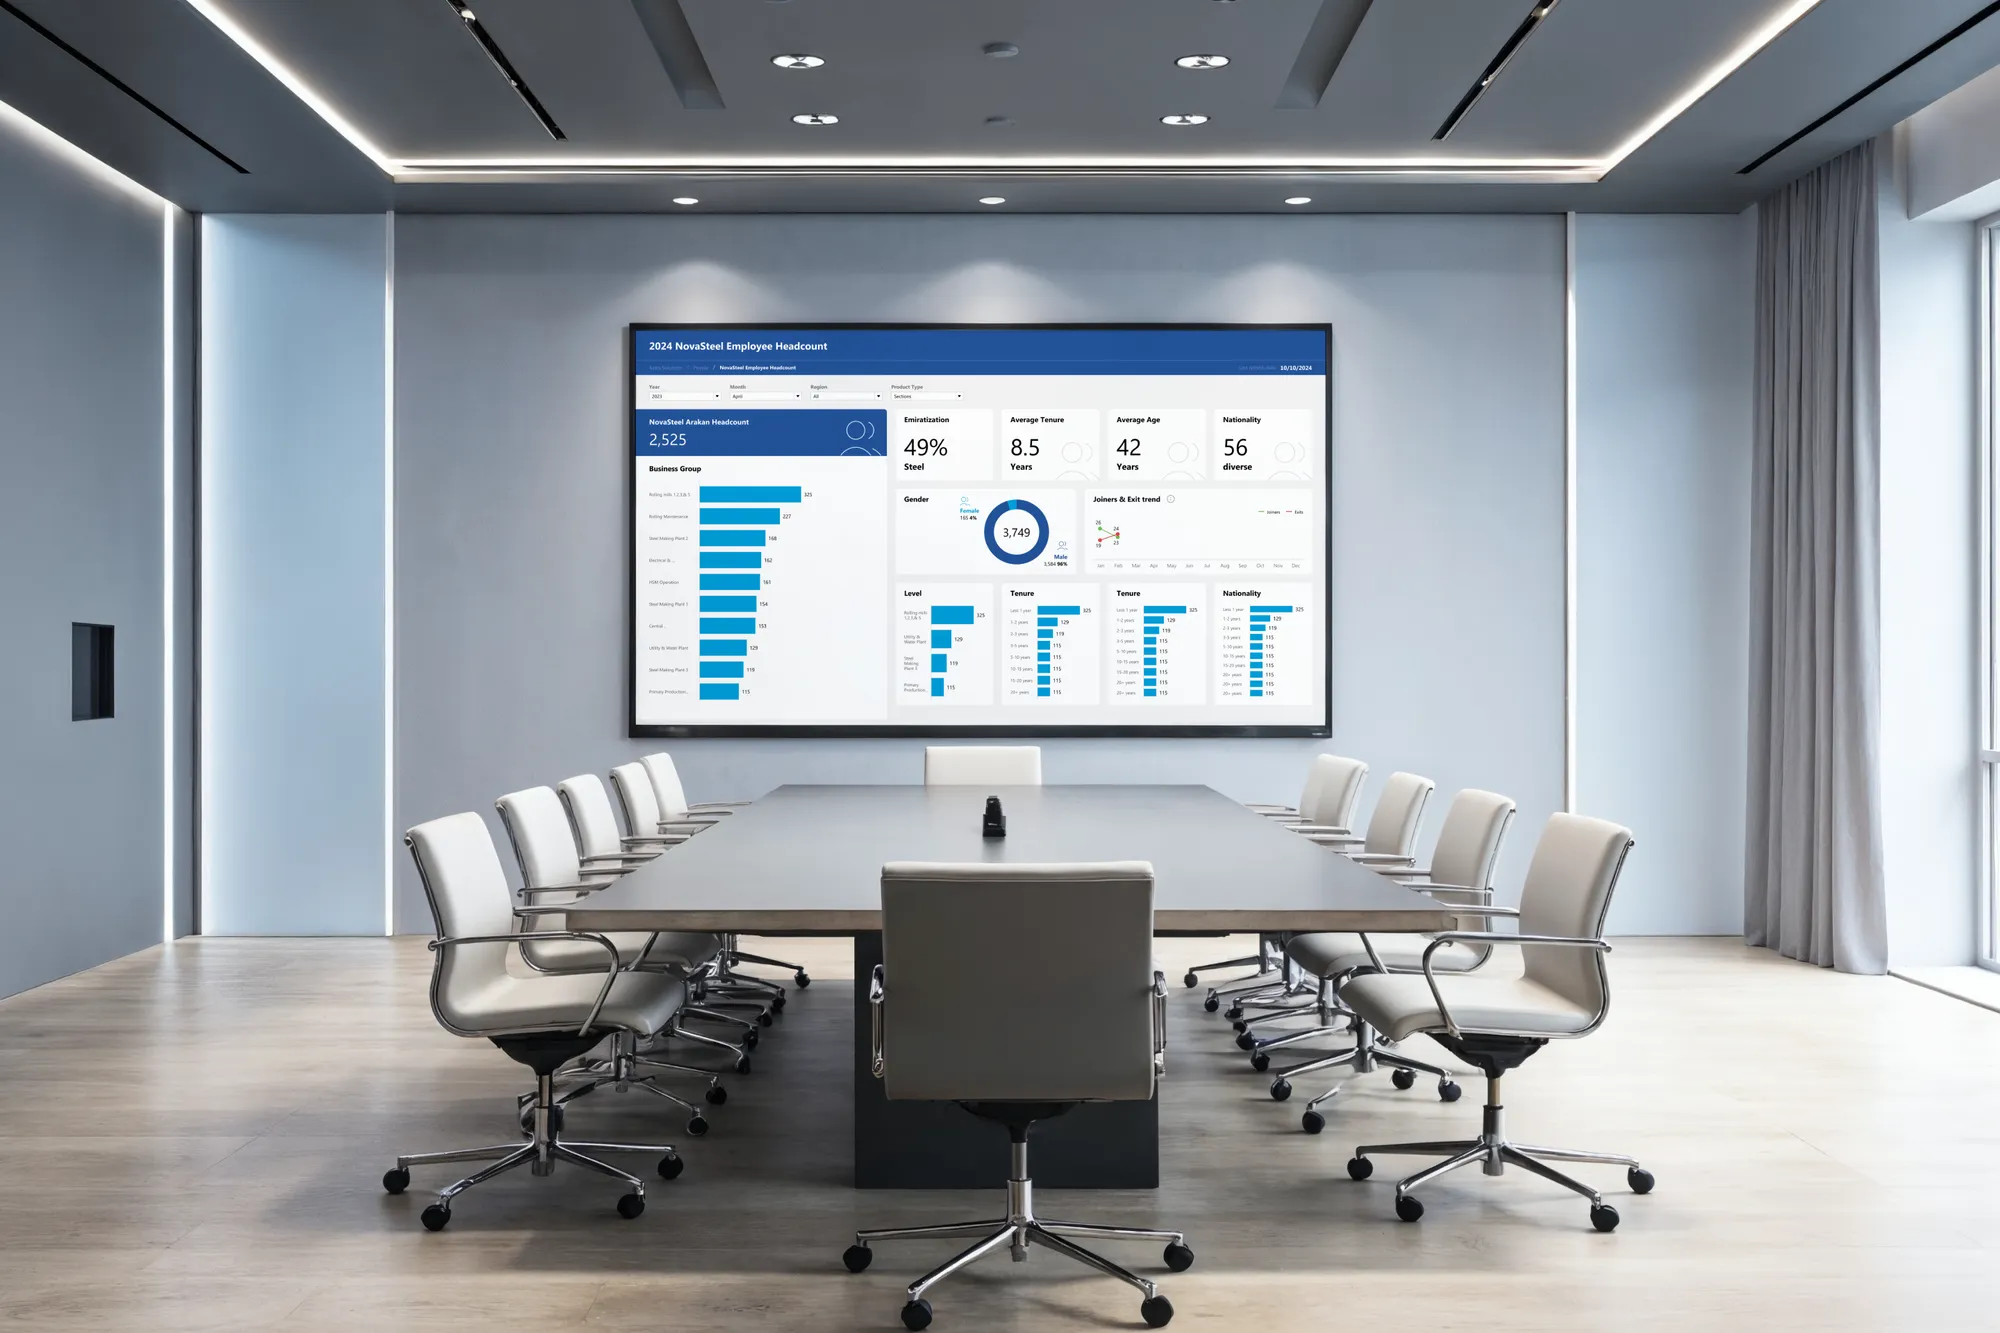
A structure built around performance, finance, and operations
The dashboard brings together key business indicators in one clear interface. Filters, KPI cards, charts, tables, and workstream views help users move from high-level performance monitoring to detailed initiative analysis without losing context.
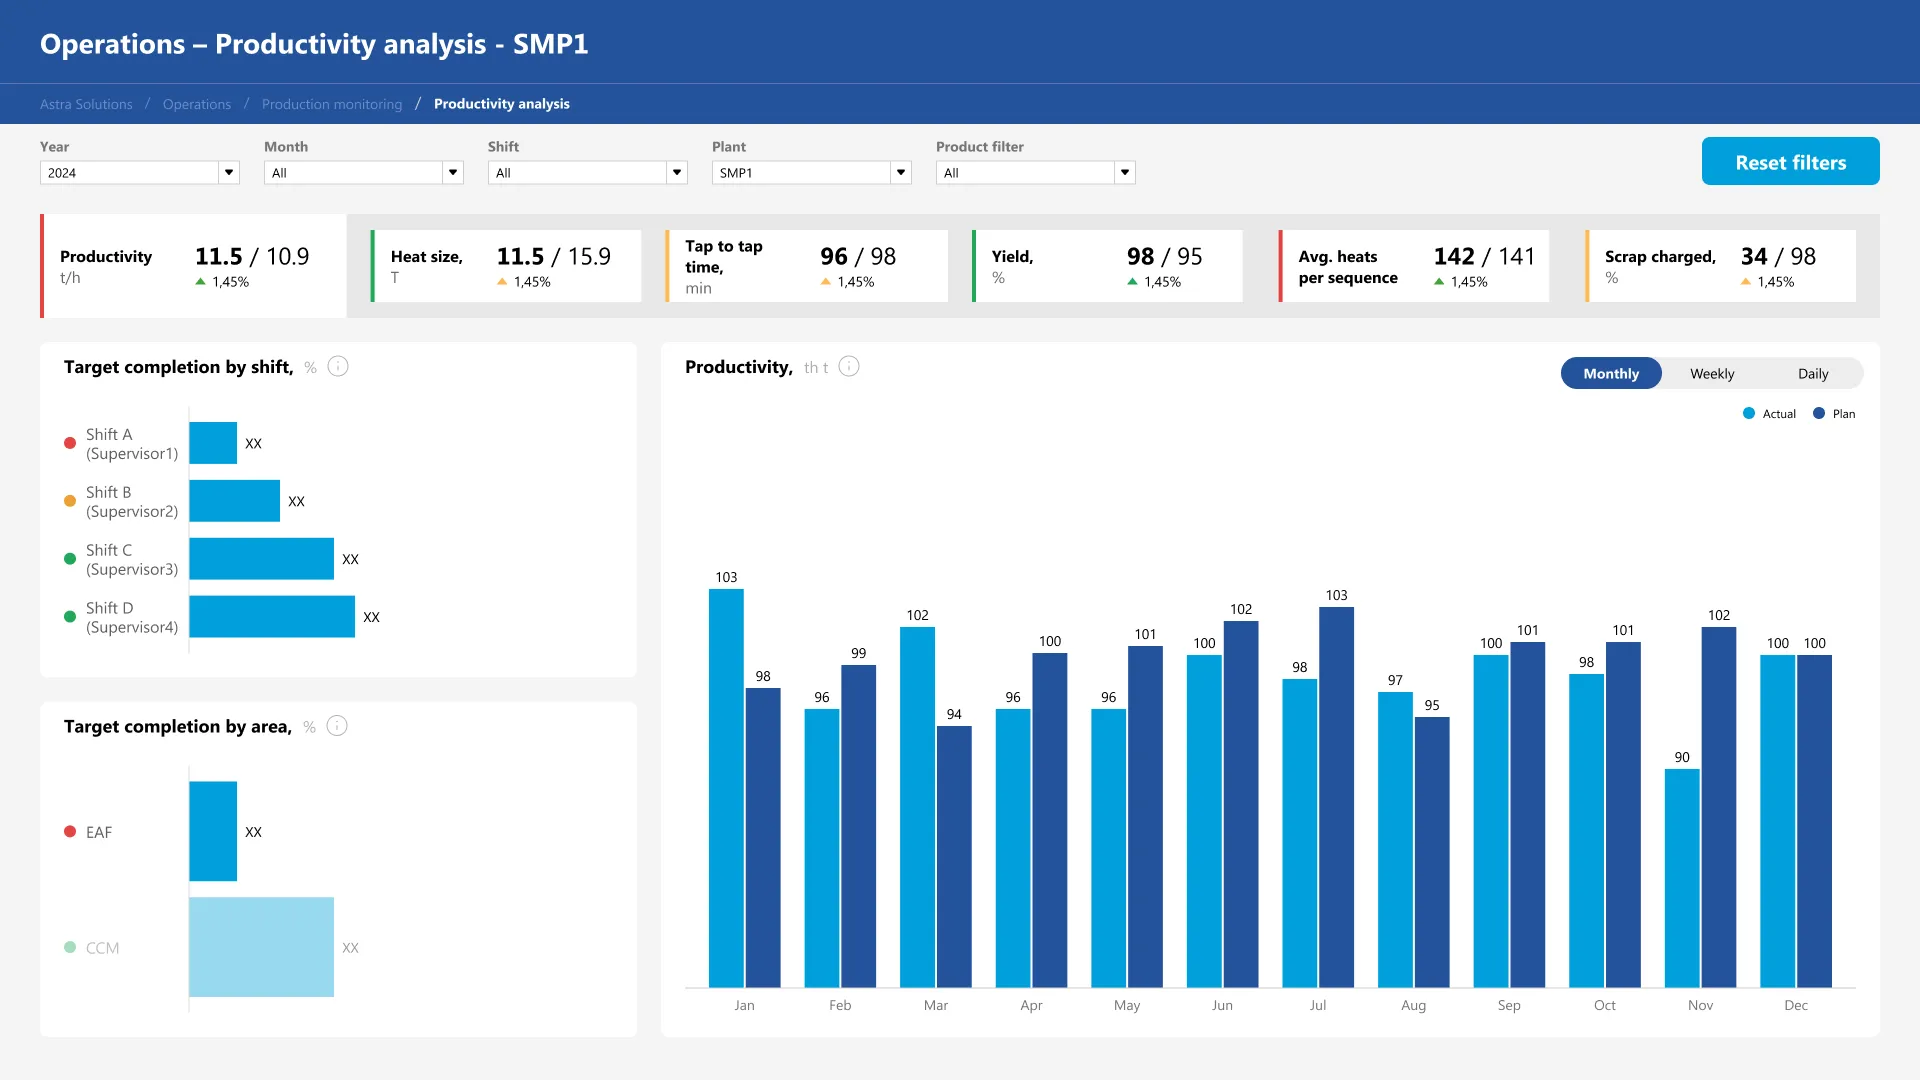
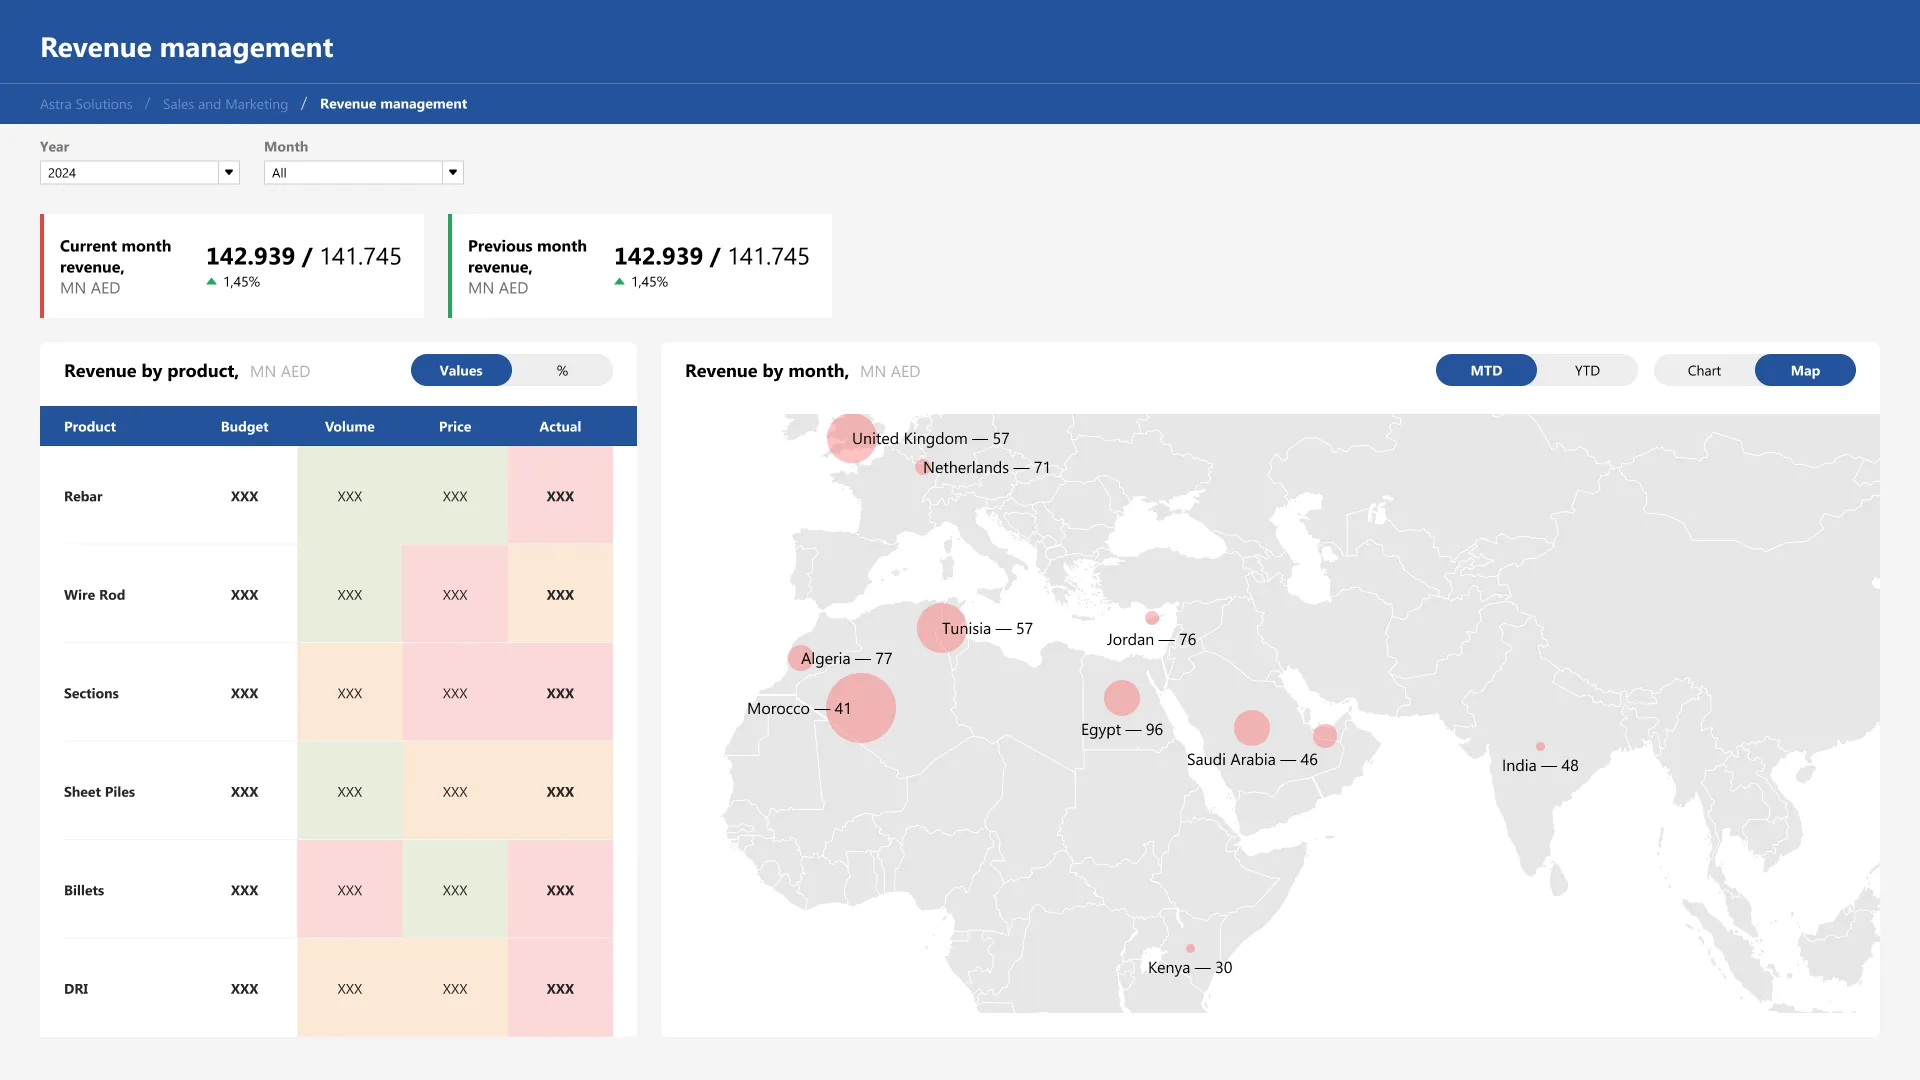
Key metrics made visible for faster interpretation
The dashboard uses clean charts, clear labels, KPI strips, and structured tables to help users quickly compare results, spot gaps, and understand performance changes. The visual system keeps business data readable even during long reporting and analysis sessions.

Design System
A small set of choices, applied with discipline.
Outcome
A dashboard system that makes performance easier to monitor, compare, and act on — giving management faster access to the insights that drive confident decisions.
Next project
Want similar
results?
Share your challenge. We'll send back a quote, timeline, and plan.